
If you need to create charts in React Js for your project, then you are right place. Here you will learn to create different types of charts like line charts, Bar charts, Area charts, Pie charts & more step by step with some examples.
Before learning it, you should have well understanding of these topics
Create React Charts using Rechart Library
You will learn to create react charts using rechart library. This library is most useful to easily create different types of animated charts that will be more user-friendly & attractive.
You have to follow these steps to create charts using react
1. Create React App
First of all , you have to create react app for creating & displaying charts on the web page.
2. Install recharts library
You have to install recharts library by running this command in your terminal
npm install recharts
3. Create charts component folder & files
When you create reat app, you will get some default files & folders. But you have to create a folder & files for charts component like. Here, I have maintioned only the neccessary folders & files.
myapp
 |__src/
    |__ charts/
    |    |__ SimpleChart.js
    |    |__ CourseLineChart.js
    |    |__ CourseBarChart.js
    |    |__ CourseAreaChart.js
    |    |__ CoursePiChart.js
    |__ App.js
    |__ index.js
Here is the common code of App.js & index.js for all charts and remaining chart components will be explained in the next steps
File Name – App.js
import React from "react"
import SimpleChart from "./charts/SimpleChart"
import CourseLineChart from "./charts/CourseLineChart"
import CourseBarChart from "./charts/CourseBarChart"
import CourseAreaChart from "./charts/CourseAreaChart"
import CoursePieChart from "./charts/CoursePieChart"

function App() {
  return (
      <React.Fragment>
          <SimpleChart />
          <CourseLineChart />
          <CourseBarChart />
          <CourseAreaChart />
          <CoursePieChart />

      </React.Fragment>
  );
}
export default App;
File Name – index.js
import ReactDOM from 'react-dom';
import App from './App';

ReactDOM.render(
<App /> ,
  document.getElementById('root')
);
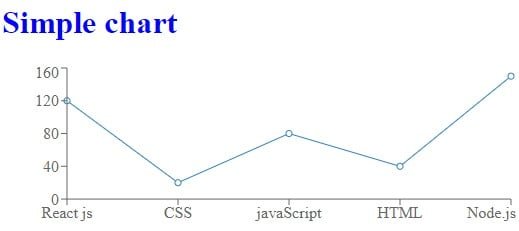
4. Write code to create Simple chart
File Name – SimpleChart.js
import React from "react";
import { ResponsiveContainer, LineChart, Line, XAxis, YAxis} from "recharts";

const simpleData = [
  {
    subject: "React js",
    fees: 120
  },
  {
    subject: "CSS",
    fees: 20
  },
  {
    subject: "javaScript",
    fees: 80
  },
  {
    subject: "HTML",
    fees: 40

  },
  {
    subject: "Node.js",
    fees : 150
  },

];
function SimpleChart(){
    return (
    <React.Fragment>
      <h1 style={{color:"blue"}}>Simple chart</h1>
      <ResponsiveContainer width="100%" aspect={3} >
       <LineChart data= {simpleData}>
         <XAxis dataKey ="subject" />
         <Line dataKey="fees" />
         <YAxis />
       </LineChart>
      </ResponsiveContainer>
    </React.Fragment>

    );
};

export default SimpleChart
5. See chart in web browser
Create Different Types of Chart in React
Now you will know to create different types of charts using rechart library from the next steps with some examples. after completing these steps, you will definately create any types of chart for your project.
Before getting started, you have to know about these general components provide by rechart library
To create charts, you have to know about these important components provided by rechart
Chart Component –
These compoents will help to create quickly attractiv & userfriendly charts
- <LineChart /> – It creates Line charts
- <BarChart /> – It create Bar charts
- <AreaChart /> – It creates Area charts
- <PieChart /> – It create Pie chart
- <ComposedChart /> – It creates Composed chart
- <ScatterChart /> – It created Scatter chart
- <RaderChar /> – It creates Rader Chart
- <RadialChart /> – It creates Radial Chart
- <Treemap /> – It creates Treemap Chart
Don’t worry, all these component will be explained separately in upcoming steps on by one
General Component –
ResponsiveContainer – This Component works as a parent container that is used to display the responsive chart in a well perfect format on different types of screen sizes. Also, It contains chart components as a child component.
<Legend /> – This component displays the name of charts and It is placed within the chart component
<Tooltip /> – This component display the information of chart while cursor moves on curves and It remains in chart component
<CartesianGrid /> – This component displays grid lines behind the chart and It remains in chart component
Create Line Chart
In this steps, You can create a line chart by importing the following required components from the “recharts”
- LineChart – is used to create a section of a line chart
- Line – is used to draw a line and
- XAxis – is used to draw an x-axis
- YAxis – is used to draw a y-axis
Also, know usage of more properties –
lineChartData – contains a static data in json array format. It can be dynamic coming from database. It must pass to the <LineChart /> component
dataKey=”fees” – It will mark position of fees
dataKey=”topics – It will also mark another position of topics
type=”monotone” – It will make curve the line at the position of fees & topics
activeDot={{r:10}} – It will be active point with radius 10 while cursor moves to the position of fees & topis. But It will work only when Tooltip activated.
Example –
File Name – CourseLineChart.js
import React from "react";
import { ResponsiveContainer, LineChart, Line, XAxis, YAxis, CartesianGrid, Legend, Tooltip} from "recharts";

const lineChartData = [
  {
    subject: "React js",
    topics: 50,
    fees: 120
  },
  {
    subject: "CSS",
    topics: 75,
    fees: 20
  },
  {
    subject: "javaScript",
    topics: 65,
    fees: 140
  },
  {
    subject: "HTML",
    topics: 90,
    fees: 40

  },
  {
    subject: "Node.js",
    topics: 70,
    fees : 150
  },
  {
    subject: "Python",
    topics: 250,
    fees: 180
  }

];
function CourseLineChart(){
    return (
    <React.Fragment>
      <h3 style={{color:"blue"}}>Course Line chart</h3>
      <ResponsiveContainer width="100%" aspect={2} >
       <LineChart data= {lineChartData} margin={{left:50, right:50, top:100, bottom:100}}>
         <CartesianGrid strokeDasharray="2 2"/>
         <Tooltip contentStyle={{backgroundColor:"lightgray"}}/>
         <Line dataKey="fees" stroke="red" activeDot={{r:10}} type="monotone" />
         <Line dataKey="topics" stroke="green" activeDot={{r:10}} type="monotone" />
         <XAxis dataKey ="subject"  interval="preserveStartEnd" tickFormatter={(value)=> value+" Language"}/>
         <YAxis />
         <Legend />
       </LineChart>
      </ResponsiveContainer>
    </React.Fragment>

    );
};

export default CourseLineChart
Result –

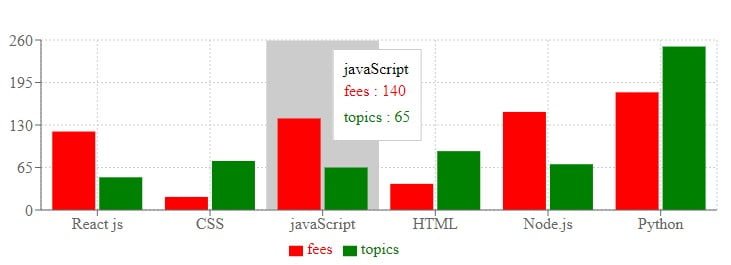
Create Bar Chart
In this steps, You can create a Bar chart by importing the following required components from the “recharts”
- BarChart – is used to create a section of a Bar chart
- Bar – is used to drawing a rectangle block at 90 degrees on the x-axis
Also, know usage of more properties –
barChartData – contains a static data in json array format. It can be dynamic coming from database. It must pass to the <BarChart /> component
dataKey=”fees” – It will fill a rectangle box up to the position of fees
dataKey=”topics – It will also fill another rectangle box up to the position of topics
File Name – CourseBarChat.js
import React from "react";
import { ResponsiveContainer, XAxis, YAxis, CartesianGrid, Legend, Tooltip, BarChart, Bar} from "recharts";

const barChartData = [
  {
    subject: "React js",
    topics: 50,
    fees: 120
  },
  {
    subject: "CSS",
    topics: 75,
    fees: 20
  },
  {
    subject: "javaScript",
    topics: 65,
    fees: 140
  },
  {
    subject: "HTML",
    topics: 90,
    fees: 40

  },
  {
    subject: "Node.js",
    topics: 70,
    fees : 150
  },
  {
    subject: "Python",
    topics: 250,
    fees: 180
  }

];
function CourseBarChart(){
    return (
    <React.Fragment>
      <h3 style={{color:"blue"}}>Course Bar chart</h3>
      <ResponsiveContainer width="100%" aspect={2}>
       <BarChart data= {barChartData} margin={{left:50, right:50, top:100, bottom:100}}>
         <CartesianGrid strokeDasharray="2 2"/>
         <Tooltip />
         <Bar dataKey="fees" fill="red" />
         <Bar dataKey="topics" fill="green" />
         <XAxis dataKey ="subject"  interval="preserveStartEnd" tickFormatter={(value)=> value+" Language"}/>
         <YAxis />
         <Legend />
       </BarChart>
      </ResponsiveContainer>
    </React.Fragment>

    );
}

export default CourseBarChart
Result –
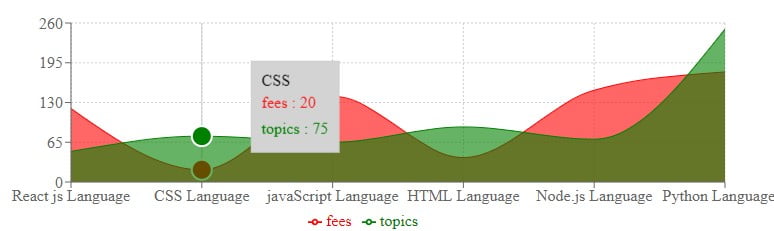
Create Area Chart
In this steps, You can create a Area chart by importing the following required components from the “recharts”
- AreaChart – is used to create a section of an Area chart
- Area – is used to drawing a block area
Also, know usage of more properties –
areaChartData – contains a static data in json array format. It can be dynamic coming from database. It must pass to the <AreaChart /> component
dataKey=”fees” – It will fill a area block up to the position of fees
dataKey=”topics – It will also fill another area block up to the position of topics
Example –
File Name – CourseAreaChart.js
import React from "react";
import { ResponsiveContainer, XAxis, YAxis, CartesianGrid, Legend, Tooltip, AreaChart, Area} from "recharts";
const areaChartData = [
  {
    subject: "React js",
    topics: 50,
    fees: 120
  },
  {
    subject: "CSS",
    topics: 75,
    fees: 20
  },
  {
    subject: "javaScript",
    topics: 65,
    fees: 140
  },
  {
    subject: "HTML",
    topics: 90,
    fees: 40

  },
  {
    subject: "Node.js",
    topics: 70,
    fees : 150
  },
  {
    subject: "Python",
    topics: 250,
    fees: 180
  }

];
function CourseAreaChart(){
    return (
    <React.Fragment>

      <h3 style={{color:"blue"}}>Course Area chart</h3>
      <ResponsiveContainer width="100%" aspect={2} >
       <AreaChart data= {areaChartData} margin={{left:50, right:50, top:100, bottom:100}}>
         <CartesianGrid strokeDasharray="2 2"/>
         <Tooltip contentStyle={{backgroundColor:"lightgray"}}/>
         <Area dataKey="fees" stroke="red" fill="red" activeDot={{r:10}} type="monotone" />
         <Area dataKey="topics" stroke="green" fill="green" activeDot={{r:10}} type="monotone" />
         <XAxis dataKey ="subject"  interval="preserveStartEnd" tickFormatter={(value)=> value+" Language"}/>
         <YAxis />
         <Legend />
       </AreaChart>
      </ResponsiveContainer>

    </React.Fragment>

    );
}

export default CourseAreaChart
Example –
Create Pi chart
In this steps, You can create a Pie chart by importing the following required components from the “recharts”
- PieChart – is used to create a section of a line chart
- Pie – is used to drawing a block of area
Also, know usage of more properties –
pieChartData – contains a static data in json array format. It can be dynamic coming from database. It must pass to the <Pie /> component
dataKey=”topics – It will create blocks of area according to the values of topics
Example –
File Name – CoursePieChart.js
import React from "react";
import { ResponsiveContainer, Tooltip, PieChart, Pie} from "recharts";

const pieChartData = [
  {
    name: "React js",
    topics: 50
  },
  {
    name: "CSS",
    topics: 75
  },
  {
    name: "javaScript",
    topics: 65,
    fees: 140
  },
  {
    name: "HTML",
    topics: 90

  },
  {
    name: "Node.js",
    topics: 70
  },
  {
    name: "Python",
    topics: 250
  }

];
function CoursePieChart(){
    return (
    <React.Fragment>
      <h3 style={{color:"blue"}}>Course Pie chart</h3>
        <ResponsiveContainer width="100%" aspect={2} >
       <PieChart>
         <Tooltip/>
         <Pie  data= {pieChartData} dataKey="topics"  cx="50%" cy="50%" outerRadius={80} fill="green" label/>

       </PieChart>
      </ResponsiveContainer>
    </React.Fragment>

    );
}

export default CoursePieChart
Example –

Recharts Reference
I have learned you with some basic example to draw charts in react js. Now, You can easily create more charts according to your project rquirements.
So, It is not enough for creating react charts, you should also learn more about it from the official site recharts.org. This site provides a lot of charts examples, Guide & API that will be more useful for you.